Richest Counties in Virginia (2026)
by Kristen Carney
Updated: February 9, 2026
Richest County in Virginia
The richest county in Virginia is Loudoun County with an average household income of $214,791 as of 2024 and 432,998 people as of 2024 according to the most current Census data available (citation).
| Rank | County | Population | Average Income | Median Income |
|---|---|---|---|---|
| 1 | Loudoun County | 432,998 | $214,791 | $181,765 |
| 2 | Falls Church city/county | 14,710 | $204,594 | $143,262 |
| 3 | Fairfax County | 1,147,837 | $195,941 | $153,637 |
| 4 | Arlington County | 236,254 | $189,970 | $142,114 |
| 5 | Fairfax city/county | 25,026 | $178,337 | $132,348 |
| 6 | Goochland County | 26,410 | $169,175 | $118,931 |
| 7 | Alexandria city/county | 156,976 | $161,240 | $119,681 |
| 8 | Stafford County | 163,466 | $160,902 | $137,807 |
| 9 | Fauquier County | 74,577 | $157,814 | $130,189 |
| 10 | Prince William County | 488,880 | $157,635 | $131,402 |
| 11 | Albemarle County | 114,919 | $146,820 | $104,392 |
| 12 | Hanover County | 112,879 | $139,805 | $112,805 |
| 13 | Clarke County | 15,216 | $139,793 | $117,111 |
| 14 | New Kent County | 25,105 | $139,439 | $123,314 |
| 15 | Poquoson city/county | 12,639 | $139,367 | $120,972 |
| 16 | Manassas city/county | 42,976 | $138,261 | $113,590 |
| 17 | James City County | 81,013 | $135,336 | $109,985 |
| 18 | York County | 71,005 | $135,038 | $109,956 |
| 19 | Powhatan County | 31,555 | $133,936 | $110,537 |
| 20 | King George County | 27,896 | $133,643 | $116,884 |
Median Income versus Average Income: Which Should You Use?
We usually suggest using median income data – either instead of or in addition to – average income data as a true indicator of wealth. If you haven’t thought about median versus average since your last standardized test, you aren’t alone. Here’s what they are:
- average is the sum of a set of numbers divided by the count of numbers in the set
- median is the middle number in the set of numbers
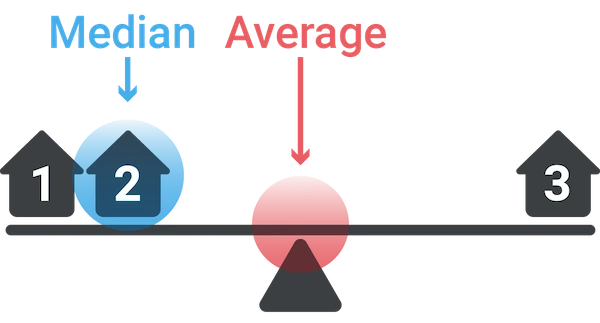
Now let’s say you had the following simplified set of income data.
Household 1: $30,000
Household 2: $50,000
Household 3: $1,000,000
The average income for this set is $360,000. The outlier data point ($1,000,000) skews the average WAY up. Conversely, the average income would be skewed WAY down if someone had an income of $500. The median income for the same data set is $50,000. Outlier data doesn’t skew the median.
Most Business Owners Should Use Median Income
So most business owners should use the median income as a true indicator of wealth, because it provides a more accurate representation of a typical income, especially in areas with significant income disparity.
When Should You Use Average Income
If your target market is high-income households, the average income may be more relevant. This is because the average income can highlight the presence of a higher concentration of wealthy individuals, which is beneficial for luxury goods and services marketing. We’re using average income on this page because using the Census’s highest reported median value of $250,001 could result in multiple ties for the richest geography.
Why do so many cities have a median value of $250,001?
The Census' American Community Survey uses $250,000+ as a jam value for median income estimates to protect privacy, ensure data consistency, and simplify reporting. A "jam value" in survey data refers to a placeholder or default value used when actual data points are unavailable, incomplete, or exceed certain thresholds. We represent this jam value as $250,001 to make it easy for you to sort.
You might also be interested in:
Email Me When New Data Are Released
Join thousands of subscribers and receive just 1 (ONE!) email a year in December when the US Census Bureau releases new income data for Virginia richest counties.
SOURCES
United States Census Bureau. Annual Estimates of the Resident Population: April 1, 2020 to July 1, 2024. U.S. Census Bureau, Population Division. Web. May 2025. http://www.census.gov/.
United States Census Bureau. B01001 SEX BY AGE, 2024 American Community Survey 5-Year Estimates. U.S. Census Bureau, American Community Survey Office. Web. 29 January 2026. http://www.census.gov/.
United States Census Bureau. B19013 Median Household Income, 2024 American Community Survey 5-Year Estimates. U.S. Census Bureau, American Community Survey Office. Web. 29 January 2026. http://www.census.gov/.
United States Census Bureau. “DP03 SELECTED ECONOMIC CHARACTERISTICS.” 2024 American Community Survey 5-Year Estimates. U.S. Census Bureau, American Community Survey Office. Web. 29 January 2026. http://www.census.gov/.
Products & Services
Plumbing
Connect
- 1-800-939-2130
- Contact Us
© Copyright 2026 Cubit Planning, Inc.